Advanced Analytics · Analysts / Researchers
↔ sharedCuRE Calculate
Analytics hub — cohorts, characterization, and submission-grade outputs.
What it does
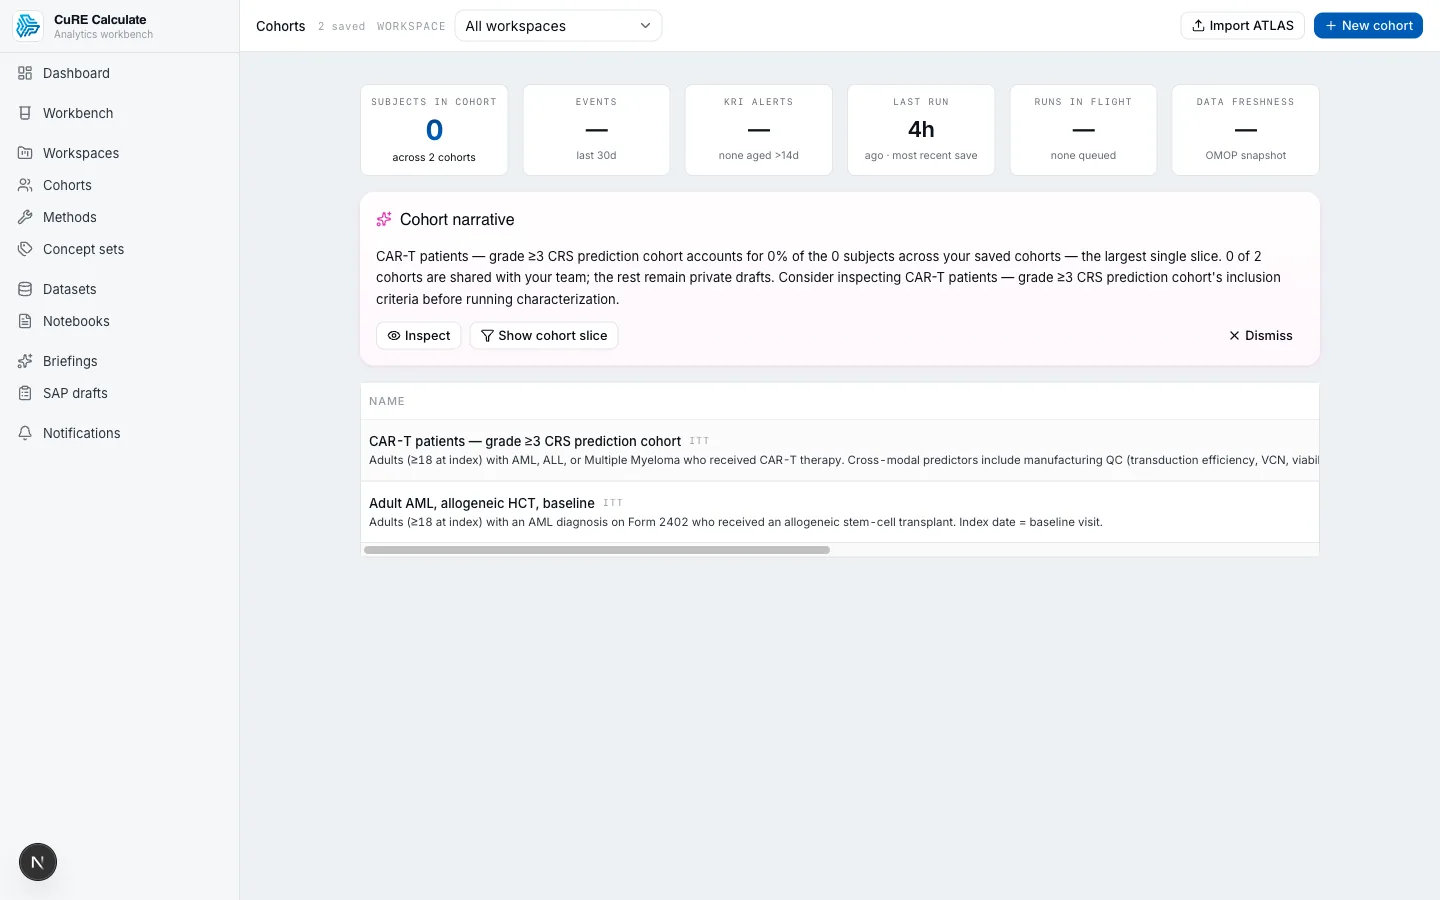
Analytics hub — cohorts, characterization, and submission-grade outputs. Cross-modal questions become native: ask whether cryopreservation, manufacturing variance, shipping time, biomarkers, ePRO, and EHR history affect CAR-T outcomes in one workspace.
Key capabilities
- In-app reactive data-science IDE (SQL/Python/R, governed)
- Collaborative notebook — chart blocks, cell-level comment threads, version-history browse
- OMOP-native cohort definitions
- Characterization studies
- Briefings template engine (AI-authored reports)
- Submission outputs (CIBMTR-style)
- Trial-design simulation + program economics (operating characteristics, GSD sizing, eNPV/VoI)
- PLE study-diagnostics + reliability gate
- Causal-design breadth (SCCS / case-control / TTE)
- Independent double-programming QC
- CEA/BIA + indirect-treatment-comparison methodology
What sets it apart
- Cross-modal questions become native: ask whether cryopreservation, manufacturing variance, shipping time, biomarkers, ePRO, and EHR history affect CAR-T outcomes in one workspace.
- A governed in-app data-science IDE is the primary surface: a reactive SQL/Python/R notebook (dependency-inferred cell-DAG, live co-editing, publish-as-data-app) on the Conduct-governed enclave, with every result egress-checked and snapshot-pinned for reproducibility — JupyterLab stays as a per-session escape hatch. Governed AI cells ride the same enclave: generate code from natural language or narrate a cell's output in prose, each egress-checked before any data reaches the model.
- Notebook collaboration is first-class: no-code chart blocks render client-side (egress-neutral), cell-level comment threads anchor discussion to the exact block, and version-history browse walks the pinned save-provenance lineage — Deepnote-class teamwork inside the governed, auditable enclave.
- Collaboration crosses org boundaries on the same governed substrate: project workspaces bind analysts, notebooks, and artifacts to an enclave; external investigators (ADR-CAL-007) join as egress-gated members whose access Conduct suspends or revokes through its documented lifecycle (DUA expiry, IRB revocation, operator offboarding); and scoped share tokens publish a method or Briefing to a collaborator without granting workspace membership.
- PLE study-diagnostics — MDRR, equipoise overlap, negative-control calibration — gate every real-world estimate, the discipline RWE buyers judge first.
- Double-programming QC, empirical calibration, negative-control diagnostics, Atlas-style characterization, and no-code builders are part of the analytics surface.
- Briefings AI-author submission-grade documents directly from the analysis — narrative, tables, and citations stay tied to the data, no copy/paste pipeline.
- Offline + live execution modes — develop against a snapshot, run against live OMOP.
- Translational PK/PD, biomarker-bridging, and empirical first-in-human dose methodology (MABEL / NOAEL→HED, SEND / Module 4) extend Calculate upstream toward IND enablement — the Translational bundle's move to first-in-human (ADR-PLT-100).
- Speaks CIBMTR: 13 NMDP/CIBMTR ATLAS donor-eligibility cohort definitions load and run as stock Circe specs, and CIBMTR-style submission outputs are native to the analytics surface, so registry reporting is a translation step, not a rebuild.
Characterize a cohort, live
Define inclusion criteria over a synthetic OMOP CDM slice and watch the characterization table recompute in your browser — demographics, condition and drug prevalence, and lab distributions, each compared against the background population. Filter to a condition and the enriched comorbidities and shifted labs fall out of the real aggregation, not a script.
Inclusion criteria over a synthetic OMOP CDM slice of 600 persons.
Condition prevalence
| Condition | Cohort vs. source | Cohort | Δ |
|---|---|---|---|
| Hypertensive disorder | 28.3% (170) | — | |
| Obesity | 26.2% (157) | — | |
| Hyperlipidemia | 21.7% (130) | — | |
| Osteoarthritis | 19.2% (115) | — | |
| Major depressive disorder | 13.2% (79) | — | |
| Type 2 diabetes mellitus | 12.5% (75) | — | |
| Atrial fibrillation | 9.5% (57) | — | |
| Chronic kidney disease | 9.0% (54) | — | |
| Asthma | 8.3% (50) | — |
Lab measurements
| Measurement | N | Mean (SD) | Median | Source mean |
|---|---|---|---|---|
| Hemoglobin A1c % | 545 | 5.6 (0.8) | 5.4 | 5.6 |
| Systolic blood pressure mmHg | 566 | 127 (13) | 125 | 127 |
| Body mass index kg/m² | 547 | 28.1 (5.4) | 27.9 | 28.1 |
| Total cholesterol mg/dL | 522 | 194 (35) | 193 | 194 |
| eGFR mL/min/1.73m² | 525 | 86 (13) | 88 | 86 |
Drug exposure
| Drug | Cohort vs. source | Cohort | Δ |
|---|---|---|---|
| Lisinopril | 21.2% (127) | — | |
| Atorvastatin | 14.7% (88) | — | |
| Sertraline | 9.3% (56) | — | |
| Metformin | 9.2% (55) | — | |
| Albuterol | 7.3% (44) | — |
Bars show the cohort rate; the vertical marker is the rate in the full synthetic source population, so an enriched feature reads as a bar overshooting its marker. Every figure is aggregated in your browser from 600 synthetic OMOP persons — change a criterion and watch it recompute.
Why this is more than a toy
This is the OHDSI cohort-characterization pattern — the same shape as FeatureExtraction — running on real OMOP standard concept IDs (SNOMED conditions, RxNorm drugs, LOINC labs). Every count, prevalence, and mean is aggregated client-side from a synthetic population of 600 persons; nothing here calls a backend. In the product, CuRE Calculate runs this characterization methodology over a governed OMOP store and emits submission-grade, validated outputs.
See CuRE Calculate in action
Every research ecosystem is unique. Let's discuss how CuRE can be configured for your needs.